Draft Documentation
This guide is currently in development. Content may be incomplete or subject to change.
Dashboard Overview
Learn how to use the auditing dashboard to view KPIs, filter data, and navigate to detailed evaluation records through summary grids.
In this guide
Filter Controls
The filter controls at the top of the dashboard allow you to narrow down the data displayed across all KPIs and grids.
Period Filter
Select from predefined options (Last 7/30/60/90 days, Previous month, Current month) or choose a custom date range.
Channel Filter
Filter by audio channel type. Most commonly used with "Audio" for voice calls.
Call Centers
Multi-select checkbox filter to include/exclude specific call centers. Use "Select All" or "Deselect All" for quick selection.
Campaigns
Multi-select filter to focus on specific campaigns (engagements).
Tip: After selecting your filters, click the Search button to apply them and refresh all dashboard data.
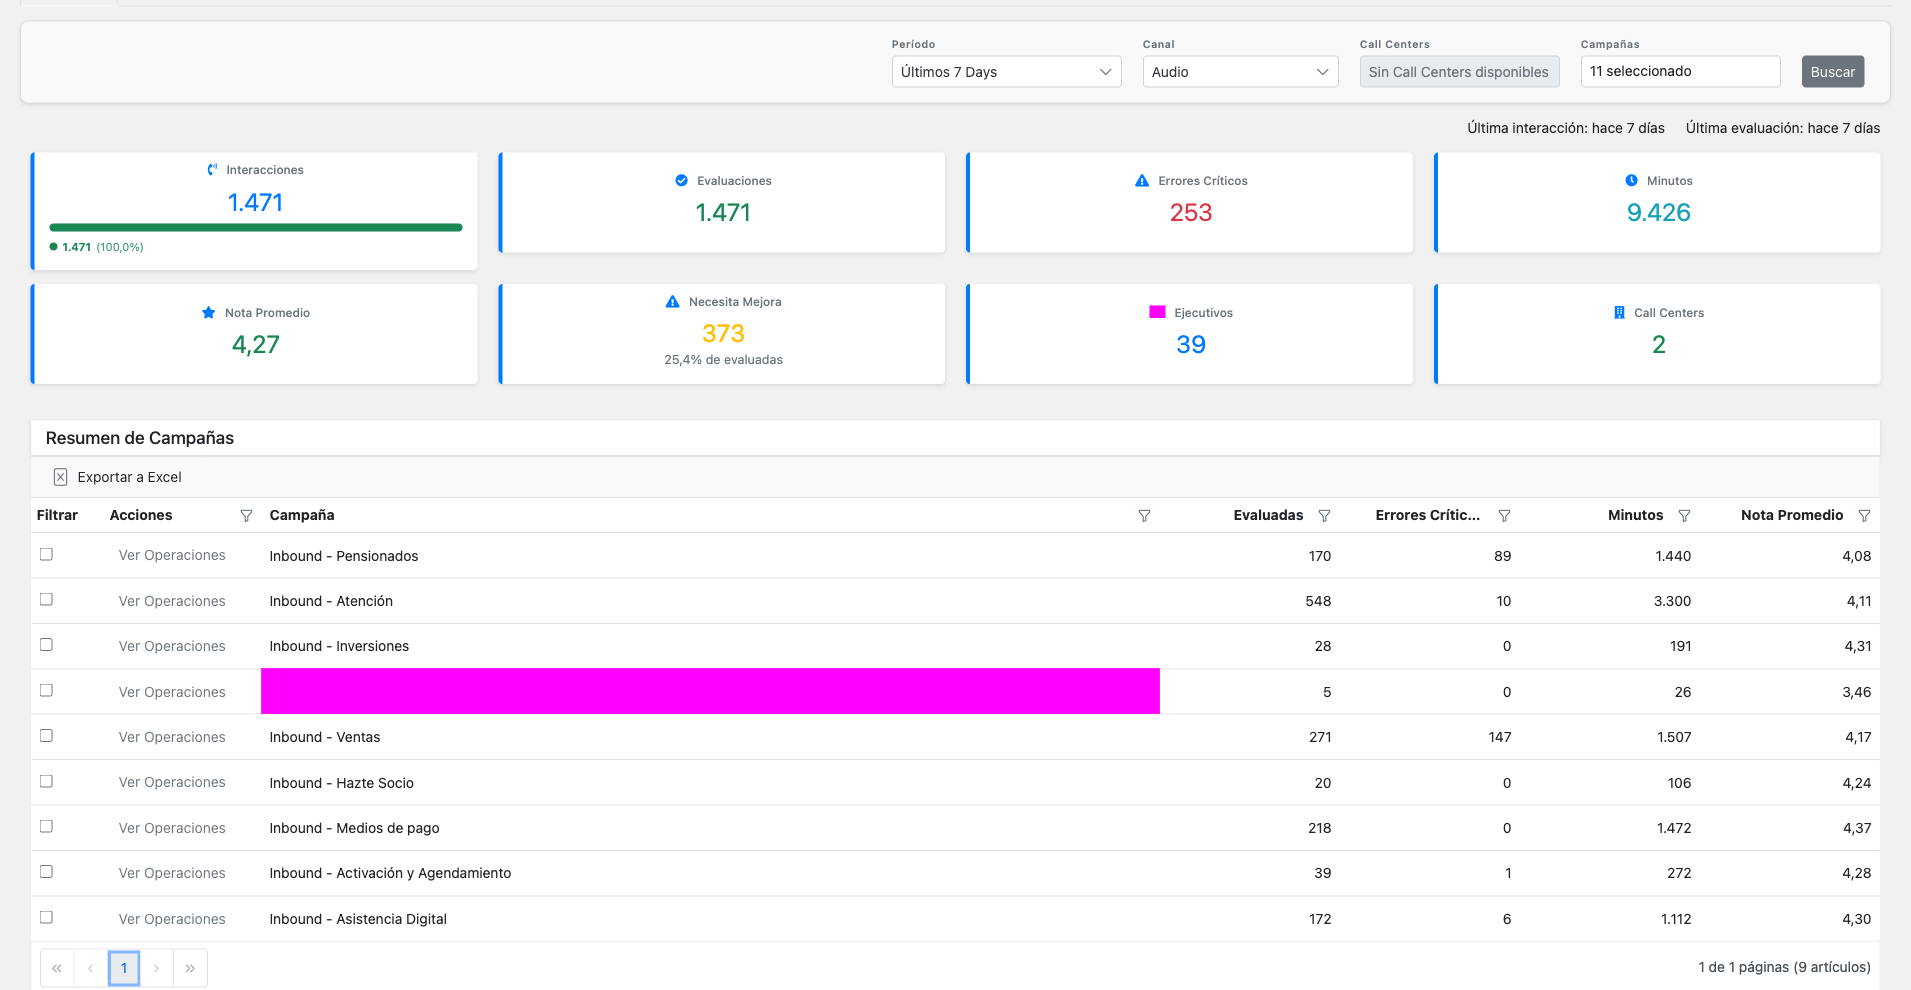
KPI Summary Cards
The dashboard displays 8 KPI cards providing a quick overview of your auditing metrics:
Total Interactions
Shows valid vs. invalid call breakdown with a progress bar visualization.
Evaluations
Total valid evaluations completed plus pending evaluations count.
Critical Errors
Count of evaluations flagged with critical errors.
Total Minutes
Aggregated audio duration across all filtered evaluations.
Average Score
Weighted average evaluation score. Color-coded: green (≥4), yellow (3-4), red (<3).
Needs Improvement
Count and percentage of evaluations scoring below 4.0.
Total Executives
Unique count of agents with evaluated conversations.
Total Call Centers
Unique count of call centers represented in the data.
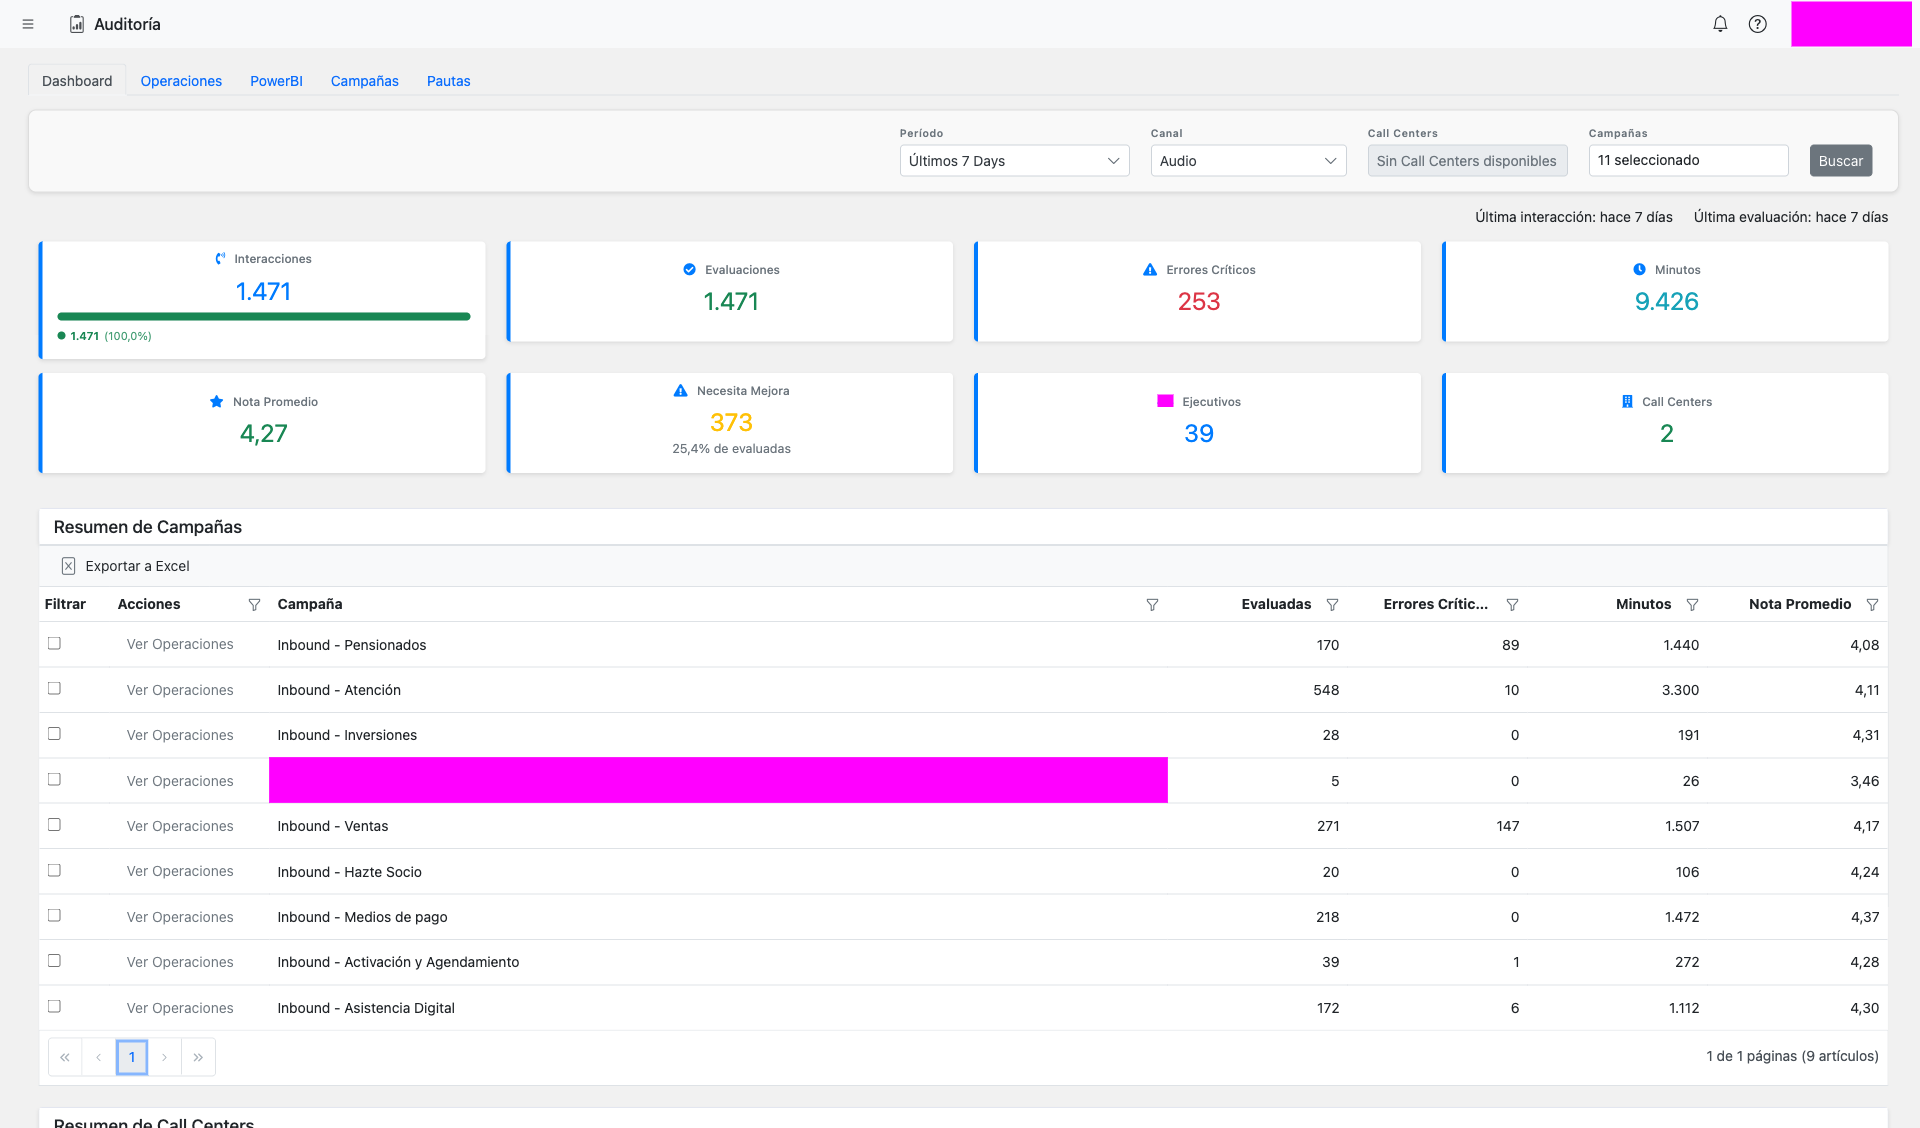
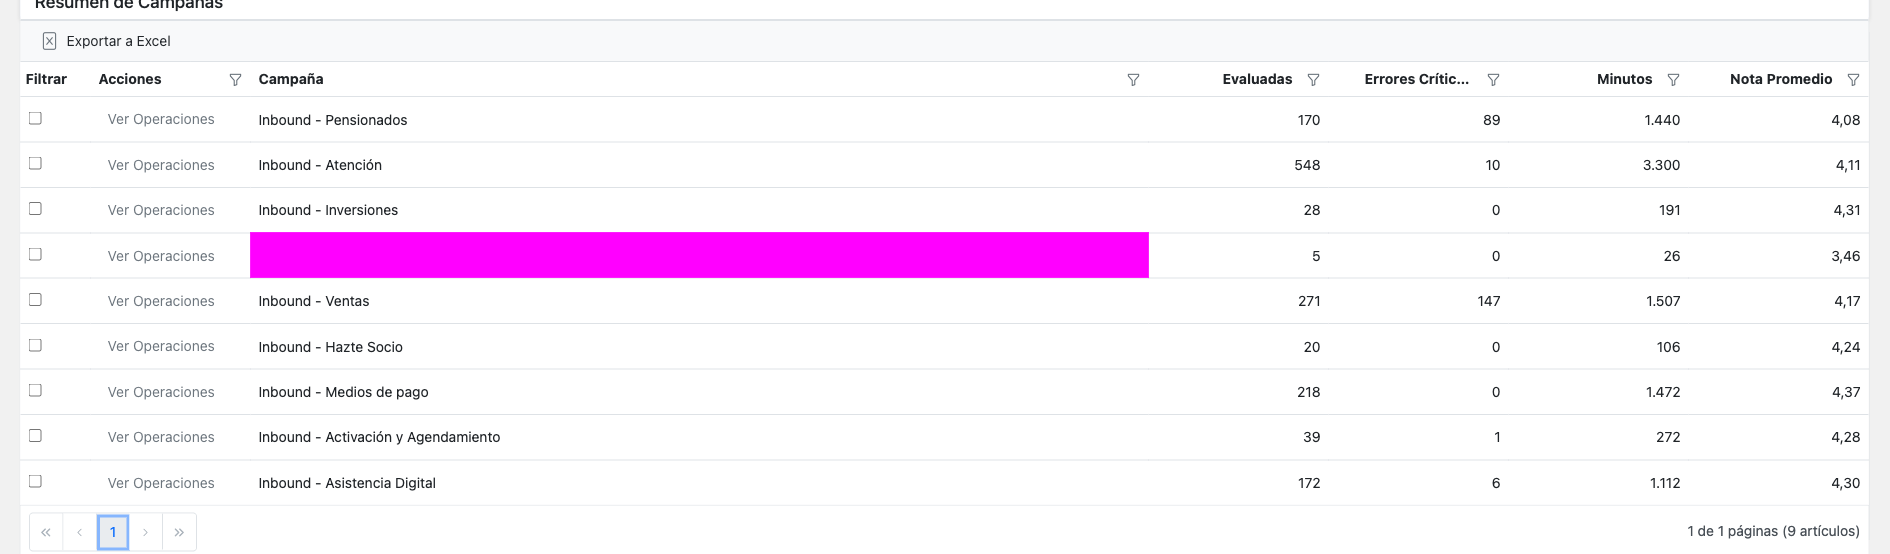
Campaigns Summary Grid
The Campaigns grid shows performance metrics aggregated by campaign (engagement).
Grid Columns:
- Campaign Name: The engagement/campaign identifier
- Valid Calls: Count of valid evaluated calls
- Critical Errors: Number of critical errors detected
- Total Minutes: Aggregated call duration
- Average Score: Weighted average evaluation score
Features:
- Checkbox Selection: Select campaigns to filter other grids
- View Operations: Navigate to filtered evaluation records
- Export to Excel: Download the grid data
Call Centers Summary Grid
Performance breakdown by call center. This grid automatically filters based on campaign selections made above.
Grid Columns:
- Call Center Name: The call center identifier
- Valid Calls: Count of evaluated calls
- Critical Errors: Error count for this call center
- Total Minutes: Call duration sum
- Average Score: Performance score
Filter Cascade: When you select campaigns in the grid above, this grid automatically updates to show only call centers that handled those campaigns.
Call Centers summary grid with filter indicator
Screenshot coming soon
Executives Ranking Grid
Individual agent performance rankings. Filters based on both campaign and call center selections from grids above.
Grid Columns:
- Executive Name: Agent identifier
- Valid Calls: Number of evaluated calls
- Critical Errors: Error count for this agent
- Total Minutes: Call duration handled
- Average Score: Individual performance score
Note: Selecting executives here affects the Evaluation Pattern grids, filtering to show only performance data for the selected agents.
Executives ranking grid showing individual agent scores
Screenshot coming soon
View Operations Link
Each summary grid has a "View Operations" button that navigates you to the Operations tab with pre-applied filters matching your current selection.
How it Works:
- Select one or more items using checkboxes in any grid
- Click the View Operations button
- The system navigates to the Operations tab
- An active filter banner shows what's being filtered
- The evaluations grid displays only matching records
Example: Select "Customer Support" campaign and "Santiago" call center, then click View Operations. You'll see only evaluations for Customer Support calls handled by the Santiago call center.
View Operations button with active filter banner in Operations tab
Screenshot coming soon