Draft Documentation
This guide is currently in development. Content may be incomplete or subject to change.
Dashboard Navigation
Master the Auralytik dashboard to monitor your conversation analytics at a glance. Learn to read KPIs, interpret trends, and navigate to detailed modules.
In this guide
Dashboard Overview
The Auralytik Dashboard is your command center for monitoring conversation analytics across all channels. It provides a real-time snapshot of system performance, business metrics, and operational health.
Tip: The dashboard automatically refreshes data when you switch between clients. All metrics shown are specific to your currently selected client.
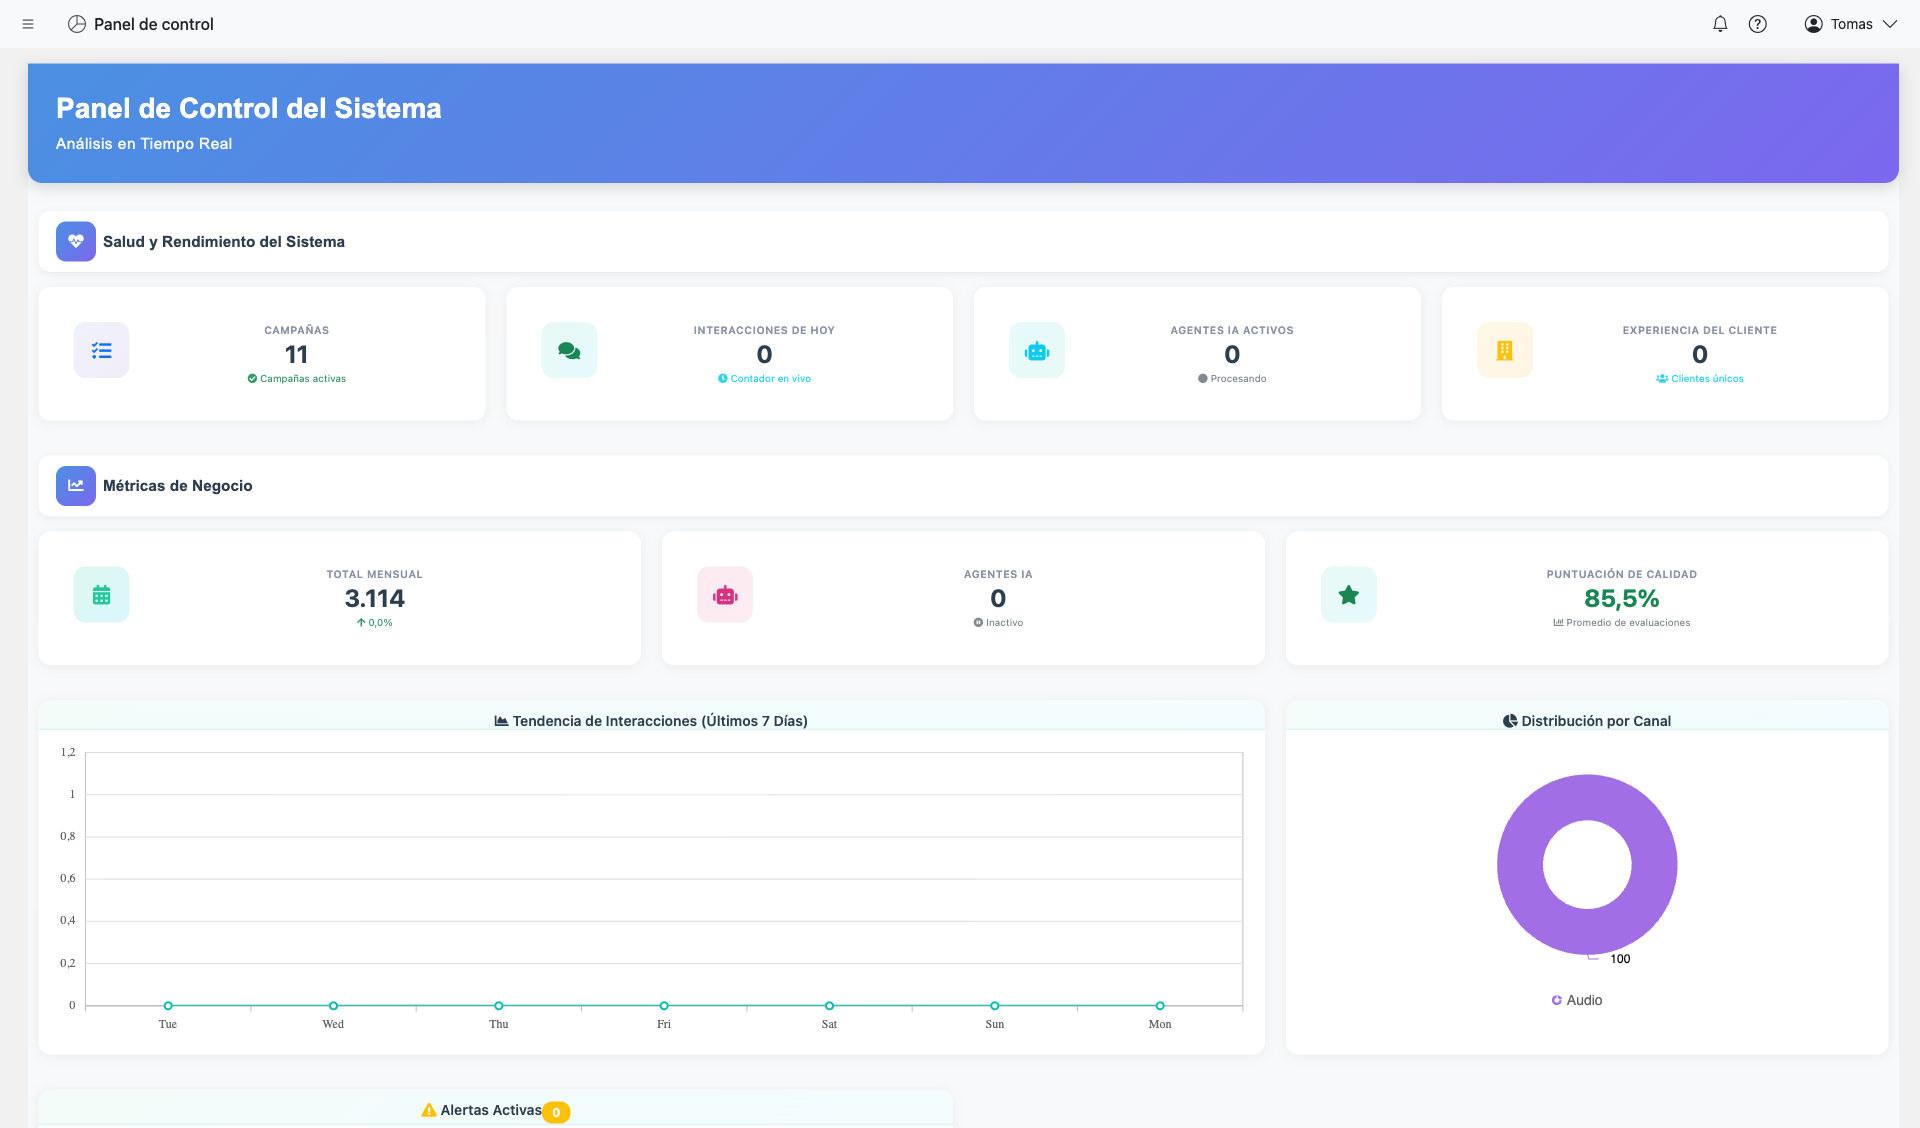
What You'll See:
- Welcome Header: Personalized greeting with the current date
- System Health Cards: Real-time operational metrics
- Business Metrics Cards: Performance indicators and trends
- Interactive Charts: Visual representations of your data
- Alerts Panel: Active notifications requiring attention
Understanding the Layout
The dashboard follows a card-based layout organized into logical sections. Each section groups related metrics for quick scanning.
Welcome Section (Header)
The gradient header displays a welcome message and subtitle. This provides context for the data you're viewing.
System Health Section
Four KPI cards showing operational status: engagements, interactions, AI agents, and client experience metrics.
Business Metrics Section
Three cards focused on business performance: monthly totals, AI agent usage, and quality scores.
Charts & Alerts Row
Visual trend charts and the alerts panel for system notifications that need your attention.
System Health KPIs
The System Health section displays four key performance indicators that give you an immediate understanding of your platform's operational status.
Active Engagements
The number of currently active campaigns or projects. Shows how many engagements are running and processing conversations.
Today's Interactions
Total number of conversations processed today. This is a live counter that updates as new interactions arrive.
AI Agents Active
Number of AI agents currently processing conversations. Shows how many automated agents are handling customer interactions.
Client Experience
Count of unique clients or end-customers that have interacted with your systems during the selected period.

Business Metrics
The Business Metrics section focuses on performance trends and quality indicators that help you understand the overall health of your operations.
Monthly Total
Total interactions processed this month with growth percentage compared to the previous month.
AI Agents
Number of configured AI agents and their current operational status.
Quality Score
Average quality score from AI evaluations across all conversations.

Note: The Quality Score is calculated from AI Auditing evaluations. If no evaluations have been processed, this metric will show 0%.
Charts & Visualizations
The dashboard includes interactive charts that visualize your data trends over time and by channel.
Interactions Trend
Spline area chart
Shows the volume of interactions over the past week or selected period. The smooth curve helps identify patterns and peak times.
- • Hover over points to see exact values
- • X-axis shows days of the week
- • Y-axis shows interaction count
Channel Distribution
Doughnut chart
Breaks down interactions by communication channel (Voice, WhatsApp, etc.) to show where your conversations are happening.
- • Hover over segments for percentages
- • Legend shows all channels
- • Click legend items to toggle visibility
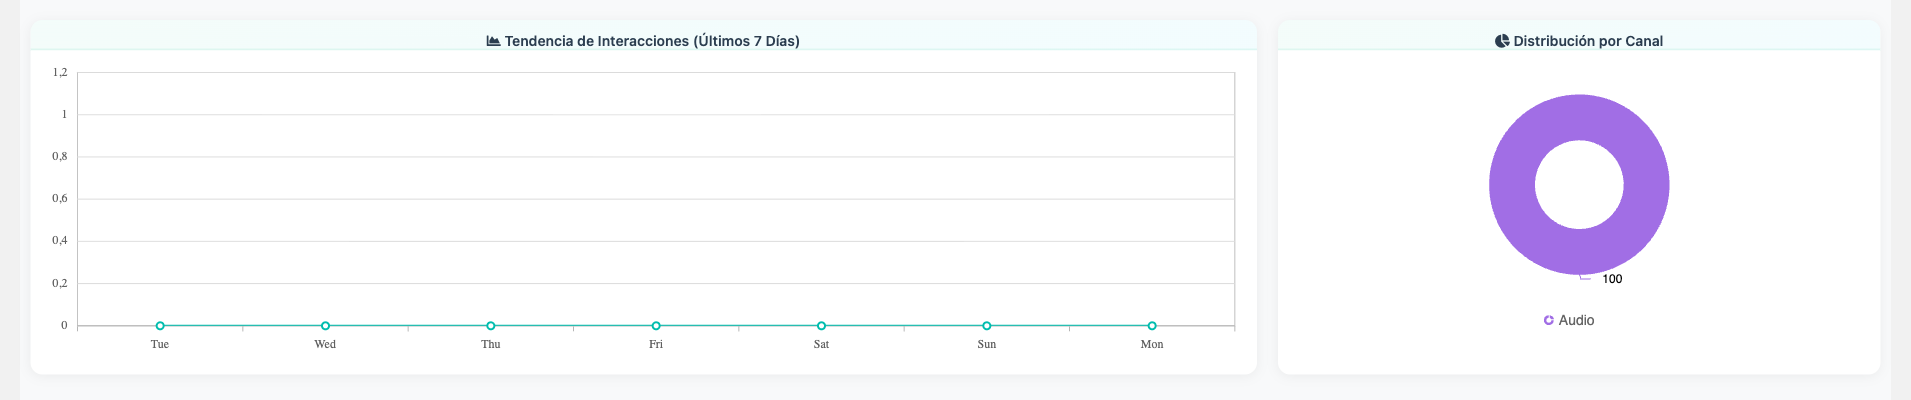
Tip: If charts show "No data available," ensure you have active engagements with processed conversations for the selected client.
Alerts & Notifications
The Alerts panel shows system notifications that may require your attention. Alerts are categorized by severity for easy prioritization.
Requires immediate attention - blinking indicator
Should be reviewed soon
Informational - review when convenient
Alerts panel showing system notifications by severity
Screenshot coming soon
Alert Information:
- Message: Description of the alert condition
- Timestamp: Shows relative time (e.g., "5 min ago", "2 hours ago")
- Severity indicator: Color-coded dot showing priority level
All clear: When there are no active alerts, you'll see a green checkmark with "No active alerts" message - this is good!
Client Switching
If you have access to multiple clients, you can switch between them to view different dashboards. All metrics update automatically when you change clients.
How to Switch Clients:
- Look for the client selector in the top navigation bar
- Click to open the dropdown menu
- Select the client you want to view
- The dashboard will automatically reload with the new client's data
Client selector dropdown in the navigation bar
Screenshot coming soon
Important: Your access to clients is managed by your administrator. If you need access to additional clients, contact your account manager.
Quick Reference
| Metric | Location | What It Shows |
|---|---|---|
| Active Engagements | System Health | Running campaigns count |
| Today's Interactions | System Health | Conversations processed today |
| AI Agents Active | System Health | Agents currently processing |
| Quality Score | Business Metrics | Average evaluation score |
| Monthly Total | Business Metrics | This month's interactions + growth % |
| Interactions Trend | Charts | Daily volume over time |
| Channel Distribution | Charts | Breakdown by channel type |